Native Module
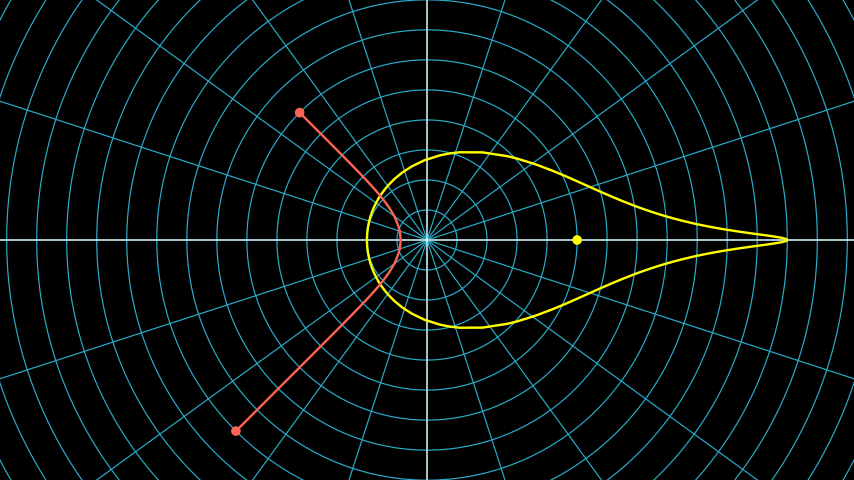
This module contains the objects that are used to visualize elements in the native representation of the hyperbolic plane. This model is also referred to as the Gans model, or the polar coordinate model, or the flattened hyperboloid model of the hyperbolic plane. It uses the entire infinite Euclidean plane to represent two-dimensional hyperbolic space. Lines are represented as branches of hyperbolas and circles appear teardrop-shaped.
Example
Example: NativeExample 
from manim import *

from hmanim.native import Circle, Dot, Line, Point

class NativeExample(Scene):
    def construct(self):
        # The plane that all our hyperbolic objects live in.
        plane = PolarPlane(
           radius_max=17.0,
           size=17,
        )
        self.add(plane)

        circle_center = Point(5, 0)
        dot = Dot(
           center=circle_center,
           plane=plane,
           color=YELLOW,
        )
        self.add(dot)
        circle = Circle(
           center=circle_center,
           radius=7,
           plane=plane,
           color=YELLOW,
        )
        self.add(circle)

        start_point = Point(6, TAU * 3 / 8)
        self.add(Dot(
           start_point,
           plane=plane,
           color=RED,
        ))
        end_point = Point(9, TAU * 5 / 8)
        self.add(Dot(
           end_point,
           plane=plane,
           color=RED,
        ))

        line = Line(
           start_point=start_point,
           end_point=end_point,
           plane=plane,
           color=RED,
        )
        self.add(line)
Usage
Drawing objects in the hyperbolic plane always starts with a PolarPlane
object. (See manim’s PolarPlane
for more information.) Every HManim object needs to get a plane
assigned. The center of an object is then considered to be relative to
the origin of that plane.
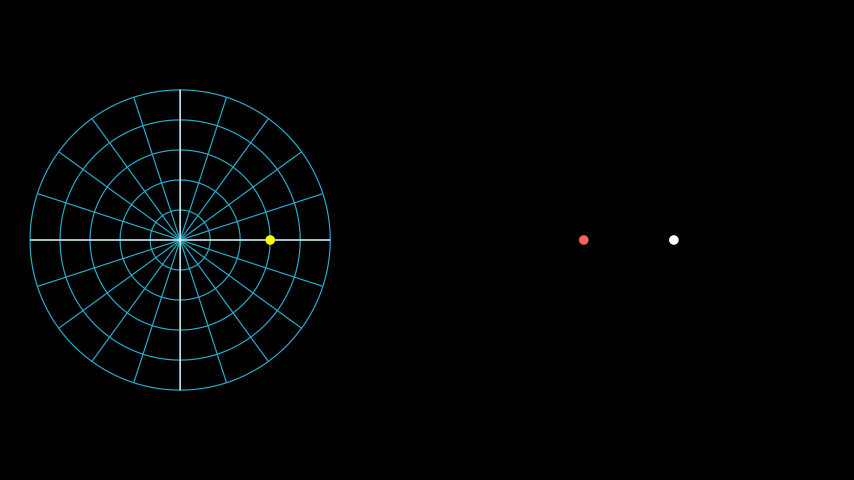
Note
Creating a PolarPlane object and passing it to the HManim objects is
sufficient. In particular, you can omit adding the plane to the scene. That
is, you can omit the self.add(plane) part. See the right plane in the
example below.
Example: PlanePositionExample 
from manim import *

from hmanim.native import Circle, Dot, Line, Point

class PlanePositionExample(Scene):
    def construct(self):
        # One plane to the left
        left_plane = PolarPlane(
           radius_max=5.0,
           size=5,
        ).to_edge(LEFT)
        self.add(left_plane)

        # Another plane to the right
        right_plane = PolarPlane(
           radius_max=5.0,
           size=5,
        ).to_edge(RIGHT)

        # Note how we do not add the plane.
        # Instead we only draw the origin for
        # visualization purposes.
        self.add(
           Dot(
              center=Point(),
              plane=right_plane,
           ),
        )

        # Add a yellow dot to the left plane.
        left_dot = Dot(
           center=Point(3.0, 0),
           plane=left_plane,
           color=YELLOW,
        )
        self.add(left_dot)

        # Add a red dot to the right plane.
        right_dot = Dot(
           center=Point(3.0, TAU / 2),
           plane=right_plane,
           color=RED,
        )
        self.add(right_dot)
Information about the available objects that can be drawn into the hyperbolic plane can be found in the Overview below. Animations are explained in the documentations of the corresponding objects that can be animated. For general documentation, you can start with Rotate, Translate, Rotated Translate, Translate and Rotate, Scale, and Set Curvature.