Graph
- class Graph(adjacencies: dict[int, list[int]], coordinates: Sequence[Point], plane: PolarPlane, using_geodesic: bool = True, curvature: float = -1, vertex_radius: float = 0.075, vertex_color=ManimColor('#FFFFFF'), vertex_opacity: float = 1.0, edge_stroke_width: float = 4.0, edge_color=ManimColor('#FFFFFF'), edge_opacity: float = 1.0, **kwargs)[source]
A graph consists of vertices (associated with
hmanim.native.point.Points) and edges (line segments between the points). The edges are drawn along the hyperbolic geodesics between the vertices.- Parameters:
adjacencies – A dictionary of the form {vertex: [adjacent_vertices]}. Assumes that all vertices are addressed by their index.
coordinates – A list of
hmanim.native.point.Pointobjects representing the coordinates of the vertices. The i-th entry is assumed to belong to vertex i.using_geodesics – A boolean indicating whether the edges should be drawn along the hyperbolic geodesics. If False, the edges are drawn as straight lines. Default is True.
curvature – A float representing the curvature of the hyperbolic plane that the graph lives in. Default is -1.
vertex_radius – A float representing the size of the
Dotobjects representing the vertices. Default is 0.075.vertex_color – The color of the
Dotobjects representing the vertices. Default is WHITE.vertex_opacity – The opacity of the
Dotobjects representing the vertices. Default is 1.0.edge_stroke_width – The width of the edges. Default is 4.0.
edge_color – The color of the edges. Default is WHITE.
edge_opacity – The opacity of the edges. Default is 1.0.
Examples
Example: GraphExample 
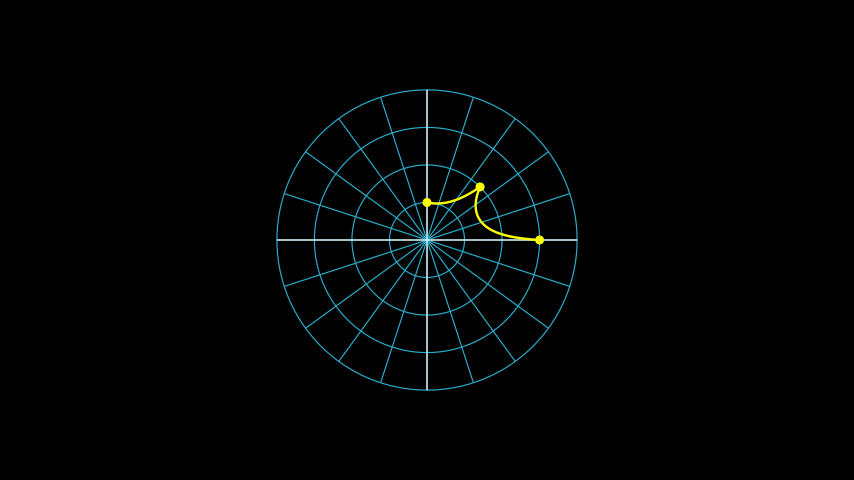
from manim import *

from hmanim.native import Graph, Point

class GraphExample(Scene):
    def construct(self):
        # The plane that all our hyperbolic objects live in.
        plane = PolarPlane(size=5)
        self.add(plane)

        graph = Graph(
            adjacencies={
                0: [1, 2],
                1: [0],
                2: [0],
            },
            coordinates=[
                Point(2, TAU / 8),
                Point(3, 0),
                Point(1, TAU / 4),
            ],
            plane=plane,
            vertex_color=YELLOW,
            edge_color=YELLOW,
        )

        self.add(graph)
from hmanim.native import Graph, Point class GraphExample(Scene): def construct(self): # The plane that all our hyperbolic objects live in. plane = PolarPlane(size=5) self.add(plane) graph = Graph( adjacencies={ 0: [1, 2], 1: [0], 2: [0], }, coordinates=[ Point(2, TAU / 8), Point(3, 0), Point(1, TAU / 4), ], plane=plane, vertex_color=YELLOW, edge_color=YELLOW, ) self.add(graph)- copy() Graph[source]
Create and return an identical copy of the
Mobjectincluding allsubmobjects.- Returns:
The copy.
- Return type:
Mobject
Note
The clone is initially not visible in the Scene, even if the original was.
- static from_files(edge_list_path: str, coordinate_list_path: str, plane: PolarPlane, using_geodesic: bool = True, curvature: float = -1, **kwargs) Graph[source]
Creates a
Graphfrom a file containing an edge list and a file containing a list of coordinates. Seeread_edge_list_from_file()andread_coordinates_from_file()for more information.- Parameters:
edge_list_path (str) – The path to the edge list file.
coordinate_list_path (str) – The path to the coordinate list file.
plane (PolarPlane) – The plane that the graph lives in.
using_geodesic (bool, optional) – Whether edges should be drawn using hyperbolic geodesics or straight lines instead. Defaults to True.
curvature (float, optional) – The curvature of the hyperbolic plane that the graph is living in. Defaults to -1.
- Returns:
The graph representing the passed edge list and coordinate list.
- Return type:
- get_edge(u: int, v: int) Line | None[source]
Get the
native.Linerepresenting the edge between vertices u and v.- Parameters:
u (int) – The index of the first vertex.
v (int) – The index of the second vertex.
- Returns:
- The
native.Line representing the edge between vertices u and v. None if the edge does not exist.
- The
- Return type:
hmanim.native.line.Line | None
- static read_coordinates_from_file(coordinate_list_path: str) list[Point][source]
Reads a list of coordinates from a file and returns a list of
hmanim.native.point.Pointobjects. Assumes that each line in the file represents one coordinate consisting of two floats separated by a space. Assumes that the coordinates are given in polar coordinates.- Parameters:
coordinate_list_path (str) – The path to the coordinate list file.
- Returns:
The list of coordinates.
- Return type:
- static read_edge_list_from_file(edge_list_path: str) dict[int, list[int]][source]
Reads an edge list from a file and returns a dictionary of the form {vertex: [adjacent_vertices]}. Assumes that each line in the file represents one edge consisting of two integers separated by a space. Additionally, assumes that the graph is undirected and that each edge is only listed in one direction.
- Parameters:
edge_list_path (str) – The path to the edge list file.
- Returns:
The adjacency list of the graph.
- Return type:
dict[int, list[int]]
- set_center_of_projection(point: Point) Graph[source]
Change the center of projection of the graph.
- Parameters:
point (hmanim.native.point.Point) – The new center of projection.
- Returns:
The graph with the new center of projection.
- Return type:
- set_curvature(curvature: float) Graph[source]
Change the curvature of the hyperbolic plane that the graph lives in. Only affects the graph and not the other objects associated with the plane.
- Parameters:
curvature (float) – The new curvature of the hyperbolic plane.
- Returns:
The graph with the new curvature.
- Return type:
- set_edge_color(color, opacity: float = 1.0) Graph[source]
Changes the color of the edges.
- Parameters:
color – The new color of the edges.
opacity (float, optional) – The new opacity of the edges. Defaults to 1.0.
- Returns:
The graph with the new edge color.
- Return type:
- set_edge_stroke_width(stroke_width: float) Graph[source]
Changes the stroke width of the edges.
- Parameters:
stroke_width (float) – The new stroke width of the edges.
- Returns:
The graph with the new edge stroke width.
- Return type:
- set_vertex_color(color, opacity: float = 1.0) Graph[source]
Changes the color of
Dotobjects representing the vertices.- Parameters:
color – The new color of the
Dotobjects.opacity (float, optional) – The opacity of the
Dotobjects. Defaults to 1.0.
- Returns:
The graph with the new vertex color.
- Return type:
- class GraphSetCurvature(mobject=None, *args, use_override=True, **kwargs)[source]
Change the curvature of the hyperbolic plane that the graph lives in.
Examples
Example: GraphSetCurvatureExample 
from manim import *

from hmanim.native import Graph, GraphSetCurvature, Point

class GraphSetCurvatureExample(Scene):
    def construct(self):
        # The plane that all our hyperbolic objects live in.
        plane = PolarPlane(size=5)
        self.add(plane)

        graph = Graph(
            adjacencies={
                0: [1, 2],
                1: [0],
                2: [0],
            },
            coordinates=[
                Point(2, TAU / 8),
                Point(3, 0),
                Point(1, TAU / 4),
            ],
            plane=plane,
            vertex_color=YELLOW,
            edge_color=YELLOW,
        )

        self.play(
            GraphSetCurvature(
                graph,
                -0.001,
            )
        )
from hmanim.native import Graph, GraphSetCurvature, Point class GraphSetCurvatureExample(Scene): def construct(self): # The plane that all our hyperbolic objects live in. plane = PolarPlane(size=5) self.add(plane) graph = Graph( adjacencies={ 0: [1, 2], 1: [0], 2: [0], }, coordinates=[ Point(2, TAU / 8), Point(3, 0), Point(1, TAU / 4), ], plane=plane, vertex_color=YELLOW, edge_color=YELLOW, ) self.play( GraphSetCurvature( graph, -0.001, ) )- interpolate_mobject(alpha: float)[source]
Interpolates the mobject of the
Animationbased on alpha value.- Parameters:
alpha – A float between 0 and 1 expressing the ratio to which the animation is completed. For example, alpha-values of 0, 0.5, and 1 correspond to the animation being completed 0%, 50%, and 100%, respectively.